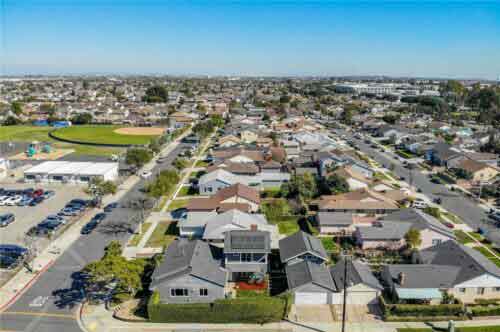
Category: Homes for sale in Lawndale CA
Pending Home Sales Continue to Rise in Lawndale
For the 4th month in a row the number of pending home sales increased quite a bit from the previous month. June saw 15 homes go into escrow which was the highest number of pending home sales in Lawndale since August of 2019. Home sales in Lawndale also increased significantly from the 2 prior months.
View the current homes for sale in Lawndale CA
At a glance: The chart below shows month by month number of active listings in Lawndale (light green bar), pending home sales (red line) and closed home sales (dark green bar)
Lawndale CA Home Sales and House Prices for June
June 2020 was a busier month after very slow April and May. June saw 12 homes sell and close escrow which was the highest number of sold homes in quite a while. To see the past 15 months of home sales visit our recent Lawndale real estate market trends and statistics post.
Current homes for sale in Lawndale CA
June 2020 Home Sales and House Prices in Lawndale CA
| MLS # | Type | Addres | Price | $ Per Foot | Bed/Bath | Sq Feet | Year | |
| SB20080323 | SFR/D | 3928 W | 157th ST | $700,000 | $683.59 | 3/1,0,0,0 | 1024/A | 1952/ASR |
| SB20091036 | CONDO/A | 4727 W | 147th ST #125 | $377,000 | $434.83 | 2/1,1,0,0 | 867/A | 1974/ASR |
| 20581604 | TWNHS | 4170 W | 147TH ST #101 | $515,000 | $388.97 | 2/3,0,0,0 | 1324/ | 1989 |
| NP20071691 | SFR/D | 4607 W | 154th ST | $560,000 | $550.64 | 3/2,0,0,0 | 1017/A | 1958/ASR |
| SB19154188 | SFR/D | 14920 | Grevillea AVE | $585,000 | $313.34 | 3/1,1,1,0 | 1867/A | 1981/ASR |
| SB20025229 | SFR/D | 4228 W | 162nd ST | $440,000 | $675.88 | 1/1,0,0,0 | 651/A | 1948/ASR |
| SB20077278 | TWNHS/A | 4746 W | 173rd ST #M | $479,000 | $467.32 | 2/1,0,1,0 | 1025/A | 1989/ASR |
| SB20094568 | TWNHS/A | 4572 W | 172nd ST #6 | $500,000 | $420.88 | 2/2,0,1,0 | 1188/A | 1992/ASR |
| CV20080286 | SFR/D | 14720 | Kingsdale AVE | $592,000 | $546.63 | 3/2,0,0,0 | 1083/A | 1962/PUB |
| SB20072616 | SFR/D | 4623 W | 169th ST | $640,000 | $557.49 | 3/1,0,0,0 | 1148/A | 1942/ASR |
| SB20053459 | TWNHS/D | 4503 W | 161st ST | $695,500 | $351.09 | 3/2,0,1,0 | 1981/A | 2007/ASR |
| SR20096602 | SFR/D | 4172 W | 166th ST | $840,000 | $403.65 | 5/3,0,0,0 | 2081/A | 1990/SEE |
May Home Sales and House Prices for Lawndale Real Estate
May was a slow month for home sales in Lawndale, CA but certainly not nearly as slow as some other nearby cities and communities. There were 5 on market home sales during the month.
View the current Lawndale homes for sale
| Type | Address | Price | $ Per Foot | Bed/Bath | Sq Feet | Year Built | |
| SFR/D | 3713 W | 157th ST | $560,000 | $389.43 | 5/1,0,0,0 | 1438/A | 1952/ASR |
| SFR/D | 15322 | Cordary AVE | $725,000 | $694.44 | 3/1,0,0,0 | 1044/A | 1951/ASR |
| SFR/D | 14531 | Burin AVE | $635,000 | $295.35 | 3/2,0,1,0 | 2150/A | 1989/ASR |
| TWNHS/A | 16714 | Inglewood AVE #B | $780,000 | $378.64 | 4/3,0,0,0 | 2060/A | 2007/ASR |
| TWNHS/D | 4547 W | 171st ST | $785,000 | $328.73 | 4/2,0,1,0 | 2388/A | 1989/ASR |
Home Sales in Lawndale CA for November 2017
November 2017 was a solid month for home sales in Lawndale CA. There were 21 sold homes in Lawndale in
the month at a median home price of $404,000. This was a 23% gain from the same month a year earlier. To see the sold homes in Lawndale and El Camino Village visit our recent home sales page.
November 2017 South Bay and Lawndale Home Sales
| City | Homes Sold | November 2017 Median | November 2016 Median | Year over Year % Change% |
| Carson | 58 | $495,000 | $455,000 | 8.8% |
| El Segundo | 19 | $875,000 | $925,000 | -5.4% |
| Gardena | 43 | $545,000 | $490,000 | 11.2% |
| Harbor City | 17 | $510,000 | $415,000 | 23% |
| Hawthorne | 50 | $578,000 | $540,000 | 6.9% |
| Hermosa Beach | 21 | $1,414,000 | $2,038,000 | -30.6% |
| Lawndale | 21 | $404,000 | $411,000 | 23% |
| Lomita | 17 | $575,000 | $580,000 | -.9% |
| Long Beach | 322 | $525,000 | $475,000 | 10.5% |
| Manhattan Beach | 28 | $2,875,000 | $2,250,000 | 27.8% |
| Marina Del Rey | 35 | $979,000 | $1,150,000 | -14.9% |
| Palos Verdes Estates | 30 | $1,600,000 | $1,825,000 | -12.3% |
| Playa Del Rey | 16 | $665,000 | $635,000 | 4.8% |
| Rancho Palos Verdes | 47 | $1,265,000 | $1,250,000 | 1.2% |
| Redondo Beach | 72 | $1,105,000 | $878,000 | 25.8% |
| San Pedro | 69 | $530000 | $588,000 | -9.8% |
| Torrance | 127 | $675,000 | $632,000 | 6.9% |
| Westchester | 38 | $1,089,000 | $1,050,000 | 3.7% |
Median Home Prices in Lawndale Up 20% over July of 2016
July was a crazy month throughout the South Bay with double digit year over year percentage changes in most of
the cities. There was no real rhyme or reason to it with some cities way up and others way down. Real estate in Lawndale CA was no different with an enormous jump of 20% for the median home prices compared with July of 2016. Hawthorne saw 35 homes sell with a very impressive median price of $730,000 was $168,000 higher than a year ago! Click here to see the recent home sales in Lawndale and the South Bay. July is often a very busy month with many homebuyers trying to purchase before the start of the school year but regardless of the reason a median home price of $730,000 in Hawthorne is a very impressive number.
| City | Homes Sold | July 2017 Median | July 2016 Median | Year over Year % Change% |
| Carson | 60 | $480,000 | $445,000 | 8% |
| El Segundo | 20 | $1,055,000 | $1,310,000 | -19.5% |
| Gardena | 65 | $549,000 | $454,000 | 21% |
| Harbor City | 15 | $439,000 | $550,000 | -20.2% |
| Hawthorne | 35 | $730,000 | $562,000 | 30% |
| Hermosa Beach | 19 | $2,025,000 | $1,410,000 | 43.6% |
| Lawndale | 15 | $515,000 | $430,000 | 19.8% |
| Lomita | 21 | $598,000 | $585,000 | 2.1% |
| Long Beach | 331 | $520,000 | $471,500 | 10.3% |
| Manhattan Beach | 48 | $2,449,000 | $2,200,000 | 11.3% |
| Marina Del Rey | 36 | $921,000 | $974,000 | -5.4% |
| Palos Verdes Estates | 28 | $1558,000 | $1,800,000 | -13.4% |
| Playa Del Rey | 20 | $613,000 | $629,000 | -2.5% |
| Rancho Palos Verdes | 63 | $1,345,000 | $1,160,000 | 15.9% |
| Redondo Beach | 95 | $975,000 | $920,000 | 6% |
| San Pedro | 63 | $542,000 | $542,000 | 0% |
| Torrance | 113 | $687,000 | $617,000 | 11.4% |
| Westchester | 33 | $1,185,000 | $1,116,000 | 6.2% |