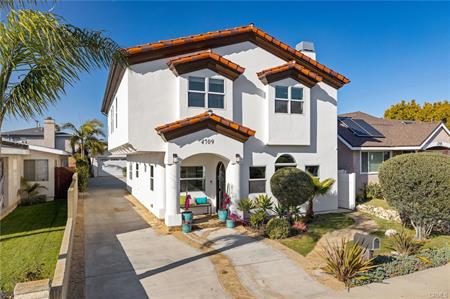
Top Lawndale Home Sale of the Year – 4709 W 171st St Sells at $1,450,000!

Take a look at all of the homes that sold in Lawndale during 2021. It was a great year with 157 on market (MLS) home sales. The average asking price was $678,000 with the average sold price at $696,000 for the year. Homes averaged only 24 days on the market before going into escrow.
View the current homes for sale in Lawndale
| Type | Address | Price | $ Per Foot | Bed/Bath | Sq Feet | Year | Sold Date | |
| SFR/D | 14916 | Firmona AVE | $750,000 | $ 403 | 3/2,0,0,1 | 1862/A | 1984/ASR | 1/5/2021 |
| CONDO/A | 4727 W | 147th ST #239 | $390,000 | $ 415 | 2/1,0,1,0 | 939/A | 1974/ASR | 1/12/2021 |
| SFR | 4173 W | 161St ST | $614,250 | $ 351 | 3/3,0,0,0 | 1750/ | 1991 | 1/12/2021 |
| SFR/D | 15633 | Larch AVE | $749,900 | $ 506 | 4/2,0,0,0 | 1483/A | 1950/ASR | 1/14/2021 |
| SFR/D | 4040 W | 160th ST | $592,000 | $ 553 | 3/2,0,0,0 | 1071/A | 1916/ASR | 1/14/2021 |
| TWNHS/A | 14927 | Condon AVE #1 | $610,000 | $ 398 | 3/2,0,1,0 | 1531/A | 1985/PUB | 1/15/2021 |
| SFR/D | 15411 | Larch AVE | $575,000 | $ 821 | 2/1,0,0,0 | 700/A | 1950/ASR | 1/20/2021 |
| SFR/D | 14611 | Firmona AVE | $580,000 | $ 701 | 2/1,0,0,0 | 827/A | 1951/ASR | 1/22/2021 |
| SFR/D | 4124 W | 159th ST | $799,000 | $ 349 | 6/1,2,0,0 | 2287/A | 1956/ASR | 1/22/2021 |
| SFR | 14316 | Kingsdale AVE | $405,000 | $ 592 | 2/1,0,0,0 | 684/ | 1948 | 1/26/2021 |
| SFR/D | 15308 | Prairie AVE | $742,000 | $ 482 | 3/2,0,0,0 | 1539/A | 1952/ASR | 1/29/2021 |
| TWNHS/A | 14807 | Condon AVE #106 | $500,000 | $ 377 | 3/2,0,1,0 | 1326/A | 1975/ASR | 1/29/2021 |
| SFR/D | 14508 | KINGSDALE AVE | $645,000 | $ 794 | 2/1,0,0,0 | 812/O | 1950/SLR | 1/29/2021 |
| SFR/D | 15437 | Grevillea AVE | $590,000 | $ 613 | 3/1,0,0,0 | 962/A | 1948/ASR | 2/2/2021 |
| SFR/D | 4738 W | 153rd PL | $600,000 | $ 606 | 3/1,0,0,0 | 990/A | 1950/ASR | 2/9/2021 |
| TWNHS/D | 4626 W | 163rd ST | $812,000 | $ 470 | 3/2,2,0,0 | 1728/B | 2020/BLD | 2/9/2021 |
| TWNHS/D | 4628 W | 163rd ST | $812,000 | $ 470 | 3/2,2,0,0 | 1728/B | 2020/BLD | 2/10/2021 |
| TWNHS/A | 4176 W | 147th ST #401 | $537,500 | $ 406 | 2/2,0,1,0 | 1324/A | 1989/ASR | 2/17/2021 |
| TWNHS/A | 4003 W | 165th ST #G | $590,000 | $ 445 | 2/3,0,0,0 | 1327/A | 1994/PUB | 2/17/2021 |
| SFR/D | 15429 | Larch AVE #E | $630,000 | $ 307 | 4/3,0,0,0 | 2052/A | 1979/ASR | 2/23/2021 |
| SFR/D | 15027 | Kingsdale AVE | $599,000 | $ 638 | 3/1,0,0,0 | 939/A | 1951/ASR | 2/25/2021 |
| TWNHS/A | 4746 W | 173rd ST #H | $552,000 | $ 539 | 2/1,0,1,0 | 1025/A | 1990/PUB | 2/26/2021 |
| SFR/D | 15322 | Kornblum AVE | $720,000 | $ 690 | 2/1,1,0,0 | 1044/A | 1951/ASR | 3/4/2021 |
| TWNHS/A | 15111 | Freeman AVE #9 | $600,000 | $ 462 | 2/1,1,1,0 | 1298/A | 1985/ASR | 3/5/2021 |
| SFR/D | 4621 W | 167th ST | $660,000 | $ 757 | 2/2,0,0,0 | 872/E | 1930/ASR | 3/5/2021 |
| SFR/D | 4705 W | 169th ST | $690,000 | $ 658 | 3/2,0,0,0 | 1048/A | 1957/ASR | 3/5/2021 |
| SFR/D | 15403 | Roselle AVE | $785,000 | $ 604 | 3/2,0,0,0 | 1300/A | 1952/ASR | 3/6/2021 |
| CONDO/D | 15209 | Larch AVE | $680,000 | $ 320 | 3/2,0,1,0 | 2127/A | 2004/ASR | 3/9/2021 |
| SFR/D | 4641 W | 161st ST | $850,000 | $ 679 | 3/2,0,0,0 | 1252/A | 1956/ASR | 3/10/2021 |
| SFR/D | 15707 | Sayler AVE | $800,000 | $ 583 | 3/1,1,0,0 | 1372/A | 1955/ASR | 3/12/2021 |
| SFR/D | 4604 W | 148th ST | $600,500 | $ 423 | 3/1,0,1,0 | 1419/A | 1961/ASR | 3/16/2021 |
| TWNHS/D | 15429 | Larch AVE #F | $697,500 | $ 340 | 4/2,0,1,0 | 2052/A | 1979/ASR | 3/16/2021 |
| SFR/D | 15519 | Roselle AVE | $780,100 | $ 762 | 3/1,0,0,0 | 1024/A | 1952/ASR | 3/22/2021 |
| TWNHS/A | 4702 W | 159th ST #C | $706,000 | $ 421 | 3/3,0,0,0 | 1675/A | 1993/ASR | 3/22/2021 |
| SFR/D | 4431 W | 162nd ST | $795,000 | $ 465 | 3/1,1,0,0 | 1711/A | 1972/ASR | 3/22/2021 |
| SFR/D | 15232 | Fonthill AVE | $865,000 | $ 520 | 3/2,0,0,0 | 1664/A | 1951/ASR | 3/25/2021 |
| TWNHS/A | 4169 | Manhattan Beach BLVD | $508,000 | $ 363 | 2/2,0,0,0 | 1399/A | 1978/ASR | 3/26/2021 |
| CONDO/A | 14807 | Condon AVE #221 | $416,000 | $ 406 | 2/1,1,0,0 | 1024/A | 1975/ASR | 3/31/2021 |
| SFR/D | 14804 | Kingsdale AVE | $635,000 | $ 526 | 2/1,0,0,0 | 1207/A | 1948/ASR | 4/2/2021 |
| SFR/D | 3852 W | 157th ST | $858,500 | $ 372 | 3/1,2,0,0 | 2306/A | 1952/ASR | 4/5/2021 |
| SFR/D | 4231 W | 164th ST | $785,000 | $ 650 | 3/2,0,0,0 | 1207/A | 1946/SLR | 4/5/2021 |
| SFR/D | 15406 | Roselle AVE | $690,000 | $ 673 | 3/1,0,0,0 | 1026/A | 1952/ASR | 4/6/2021 |
| SFR/D | 4544 W | 156th ST | $844,000 | $ 525 | 4/2,0,1,0 | 1608/A | 1956/ASR | 4/8/2021 |
| SFR/D | 15413 | Roselle AVE | $750,000 | $ 732 | 3/1,0,0,0 | 1024/A | 1952/ASR | 4/9/2021 |
| CONDO/A | 4727 W | 147Th ST #119 | $460,000 | $ 403 | 3/2,0,0,0 | 1141/A | 1974/ASR | 4/9/2021 |
| SFR/D | 4709 W | 171st ST | $1,450,000 | $ 442 | 5/3,0,0,0 | 3284/A | 2007/ASR | 4/15/2021 |
| SFR/D | 15202 | Fonthill AVE | $810,000 | $ 526 | 3/2,0,0,0 | 1539/A | 1951/ASR | 4/20/2021 |
| SFR/D | 4137 W | 159th ST | $640,000 | $ 500 | 3/1,1,0,0 | 1280/A | 1954/ASR | 4/20/2021 |
| SFR/D | 15626 | Larch AVE | $670,000 | $ 495 | 3/3,0,0,0 | 1353/A | 2003/ASR | 4/21/2021 |
| CONDO/A | 14807 | Condon AVE #118 | $479,000 | $ 510 | 2/2,0,0,0 | 939/A | 1975/ASR | 4/28/2021 |
| SFR/D | 15323 | Yukon Ave. | $870,000 | $ 553 | 4/2,0,0,0 | 1572/A | 1977/ASR | 4/29/2021 |
| SFR | 15133 | Florwood AVE | $780,000 | $ 704 | 3/1,0,0,0 | 1108/ | 1951 | 4/30/2021 |
| TWNHS/A | 15111 | Freeman AVE #24 | $610,000 | $ 451 | 3/2,0,1,0 | 1352/A | 1985/ASR | 4/30/2021 |
| SFR/D | 4035 W | 159th ST | $740,100 | $ 544 | 3/0,2,0,0 | 1361/A | 1940/ASR | 5/3/2021 |
| SFR/D | 14929 | Grevillea AVE | $800,000 | $ 379 | 3/2,0,1,0 | 2110/A | 1989/ASR | 5/4/2021 |
| SFR/D | 15307 | Condon AVE | $625,000 | $ 926 | 2/1,0,0,0 | 675/A | 1951/ASR | 5/14/2021 |
| SFR/D | 4339 W | 163rd ST | $605,000 | $ 362 | 2/2,0,0,0 | 1669/A | 1948/ASR | 5/19/2021 |
| CONDO/A | 4057 W | 147 ST #106 | $620,000 | $ 368 | 3/2,0,0,1 | 1685/P | 1995/PUB | 5/26/2021 |
| TWNHS/A | 4721 W | 170th ST | $810,000 | $ 415 | 4/3,0,0,0 | 1952/A | 2004/PUB | 5/30/2021 |
| SFR/D | 4604 W | 162nd ST | $745,000 | $ 675 | 2/1,1,0,0 | 1104/A | 1924/ASR | 6/7/2021 |
| SFR/D | 14424 | Firmona AVE | $610,000 | $ 472 | 3/2,0,0,0 | 1292/A | 1961/PUB | 6/11/2021 |
| CONDO/A | 14807 | Condon AVE #212 | $459,000 | $ 489 | 2/2,0,0,0 | 939/A | 1975/ASR | 6/15/2021 |
| SFR/D | 15011 | Kingsdale AVE | $840,000 | $ 386 | 3/2,0,1,0 | 2177/A | 1990/ASR | 6/15/2021 |
| SFR/D | 4134 W | 165th ST | $825,000 | $ 413 | 3/2,0,0,0 | 2000/A | 1969/ASR | 6/15/2021 |
| SFR/D | 15503 | Roselle AVE | $755,000 | $ 710 | 3/1,0,0,0 | 1063/A | 1952/ASR | 6/17/2021 |
| CONDO/A | 4633 | Marine AVE #245 | $425,000 | $ 441 | 2/2,0,0,0 | 963/A | 1973/ASR | 6/17/2021 |
| CONDO/A | 14807 | Condon AVE #221 | $523,000 | $ 511 | 2/2,0,0,0 | 1024/A | 1975/ASR | 6/17/2021 |
| TWNHS/D | 4501 W | 171st ST | $940,000 | $ 356 | 4/1,1,1,0 | 2638/A | 2007/PUB | 6/18/2021 |
| CONDO/A | 4633 | Marine AVE #261 | $340,000 | $ 643 | 1/1,0,0,0 | 529/A | 1973/PUB | 6/18/2021 |
| TWNHS/D | 4551 W | 171st ST | $875,000 | $ 400 | 3/2,0,1,0 | 2188/A | 1989/ASR | 6/22/2021 |
| SFR/D | 15132 | Doty AVE | $795,500 | $ 798 | 3/1,0,0,0 | 997/A | 1951/ASR | 6/25/2021 |
| SFR/D | 14800 | Burin AVE | $719,000 | $ 378 | 4/3,0,0,0 | 1904/A | 1966/ASR | 6/25/2021 |
| SFR/D | 4564 W | 156th ST | $735,000 | $ 420 | 4/2,0,1,0 | 1751/A | 2006/ASR | 6/25/2021 |
| SFR/D | 4323 W | 171st ST | $695,000 | $ 693 | 3/1,0,0,0 | 1003/A | 1944/ASR | 7/6/2021 |
| SFR/D | 14418 | Kingsdale AVE | $615,000 | $ 568 | 3/2,0,0,0 | 1083/A | 1962/ASR | 7/8/2021 |
| SFR/D | 15211 | Polly AVE | $921,415 | $ 527 | 4/3,0,0,0 | 1747/A | 1977/ASR | 7/12/2021 |
| CONDO/A | 15111 | Freeman AVE #92 | $660,000 | $ 482 | 3/2,0,1,0 | 1369/A | 1985/ASR | 7/13/2021 |
| SFR/A | 4625 W | 145th ST | $855,000 | $ 530 | 4/3,0,0,0 | 1614/A | 1951/ASR | 7/13/2021 |
| CONDO/A | 4315 W | 145th ST #5 | $532,000 | $ 399 | 3/3,0,0,0 | 1333/A | 1994/ASR | 7/15/2021 |
| SFR/D | 15414 | Condon AVE | $650,000 | $ 892 | 2/1,0,0,0 | 729/A | 1951/ASR | 7/19/2021 |
| SFR/D | 4625 W | 162nd ST | $688,000 | $ 673 | 3/1,0,0,0 | 1023/A | 1956/PUB | 7/19/2021 |
| SFR/D | 4143 W | 159th ST | $772,000 | $ 634 | 3/1,1,0,0 | 1218/A | 1949/PUB | 7/20/2021 |
| SFR/D | 4735 W | 172nd ST | $880,000 | $ 925 | 3/1,0,0,0 | 951/A | 1953/ASR | 7/20/2021 |
| SFR/D | 4327 W | 163rd ST | $615,000 | $ 792 | 2/1,0,0,0 | 777/A | 1947/APP | 7/23/2021 |
| SFR | 4743 W | 164Th ST | $930,000 | $ 517 | 4/3,0,0,0 | 1800/OTH | 1952/ASR | 7/23/2021 |
| CONDO/A | 4727 W | 147th ST #231 | $435,000 | $ 502 | 2/2,0,0,0 | 867/A | 1974/ASR | 7/26/2021 |
| SFR/D | 14507 | Larch AVE | $560,000 | $ 459 | 3/1,0,1,0 | 1220/A | 1965/ASR | 7/27/2021 |
| SFR/D | 15004 | Mansel AVE | $675,000 | $ 314 | 3/2,0,0,1 | 2147/A | 1980/ASR | 7/27/2021 |
| SFR/D | 15413 | Doty AVE | $770,000 | $ 724 | 3/1,0,0,0 | 1063/A | 1952/ASR | 7/28/2021 |
| SFR/D | 15403 | Florwood AVE | $735,000 | $ 713 | 3/1,0,0,0 | 1031/A | 1952/ASR | 7/30/2021 |
| TWNHS/A | 4157 W | 166th ST | $789,000 | $ 372 | 3/2,0,1,0 | 2119/A | 2003/ASR | 7/30/2021 |
| SFR/D | 15316 | Kornblum AVE | $720,000 | $ 651 | 3/1,0,0,0 | 1106/A | 1951/ASR | 8/3/2021 |
| SFR/D | 15232 | Cordary AVE | $877,000 | $ 578 | 3/2,0,0,0 | 1518/A | 1951/ASR | 8/3/2021 |
| CONDO | 14807 | Condon AVE #211 | $510,000 | $ 543 | 2/2,0,0,0 | 939/ | 1975 | 8/4/2021 |
| SFR/D | 4561 W | 162nd ST | $770,000 | $ 605 | 4/2,0,0,0 | 1272/A | 1954/ASR | 8/5/2021 |
| DPLX/D | 4307 W | 160th ST | $730,000 | $ 424 | 5/2,0,0,0 | 1722/SEE | 1961/SEE | 8/16/2021 |
| SFR/D | 15008 | Mansel AVE | $835,000 | $ 440 | 3/2,0,1,0 | 1897/A | 1984/ASR | 8/18/2021 |
| SFR/D | 15603 | Florwood AVE | $965,000 | $ 758 | 3/2,0,0,0 | 1273/A | 1952/PUB | 8/20/2021 |
| SFR/D | 4722 W | 166th ST | $950,000 | $ 810 | 3/2,0,0,0 | 1173/O | 1942/PUB | 8/25/2021 |
| SFR/D | 15522 | Cordary AVE | $890,000 | $ 736 | 3/2,0,0,0 | 1210/T | 1952/ASR | 8/26/2021 |
| CONDO | 4727 W | 147Th ST #122 | $390,000 | $ 450 | 2/2,0,0,0 | 867/ | 1974 | 8/27/2021 |
| SFR/D | 15206 | Cordary AVE | $820,000 | $ 590 | 4/2,0,0,0 | 1390/A | 1951/ASR | 8/31/2021 |
| SFR/D | 15329 | Doty AVE | $812,500 | $ 778 | 3/1,0,0,0 | 1044/A | 1951/ASR | 9/14/2021 |
| SFR/D | 15226 | Prairie AVE | $795,107 | $ 733 | 3/1,0,0,0 | 1085/A | 1952/ASR | 9/17/2021 |
| CONDO/A | 14528 | Avis AVE #6 | $450,000 | $ 456 | 2/2,0,0,0 | 987/A | 1989/ASR | 9/20/2021 |
| TWNHS/A | 15111 | Freeman AVE #90 | $658,000 | $ 489 | 3/3,0,0,0 | 1345/A | 1985/ASR | 9/20/2021 |
| SFR/D | 15220 | Prairie AVE | $795,500 | $ 739 | 3/1,0,0,0 | 1077/A | 1952/ASR | 9/23/2021 |
| DPLX/A | 15015 | Osage AVE | $710,000 | $ 228 | 6/4,0,0,0 | 3120/A | 1983/ASR | 9/24/2021 |
| CONDO/A | 4727 W | 147th ST #137 | $395,000 | $ 426 | 2/2,0,0,0 | 928/A | 1974/ASR | 9/27/2021 |
| SFR/D | 15224 | Condon AVE | $625,000 | $ 716 | 2/1,0,0,0 | 873/A | 1952/ASR | 9/28/2021 |
| SFR/D | 15503 | Cordary AVE | $775,000 | $ 438 | 3/1,2,0,0 | 1771/S | 1952/ASR | 9/30/2021 |
| CONDO/A | 4727 W | 147th ST #219 | $505,000 | $ 443 | 3/2,0,0,0 | 1141/A | 1974/ASR | 10/5/2021 |
| TWNHS/D | 4169 W | 166th ST | $940,000 | $ 362 | 4/4,0,0,0 | 2594/A | 2007/ASR | 10/5/2021 |
| SFR/D | 15303 | Kornblum AVE | $778,000 | $ 702 | 3/1,0,0,0 | 1108/A | 1951/ASR | 10/6/2021 |
| SFR/D | 3728 W | 156th ST | $763,000 | $ 598 | 3/2,0,0,0 | 1276/A | 1952/ASR | 10/8/2021 |
| CONDO/A | 4633 | Marine AVE #214 | $460,000 | $ 482 | 2/2,0,0,0 | 955/A | 1973/ASR | 10/8/2021 |
| SFR/D | 4549 W | 160th ST | $630,000 | $ 870 | 2/1,0,0,0 | 724/A | 1947/ASR | 10/12/2021 |
| SFR/D | 4611 W | 149th ST | $870,000 | $ 492 | 3/2,0,0,0 | 1768/A | 1968/ASR | 10/13/2021 |
| SFR/D | 15213 | Cranbrook AVE | $820,000 | $ 486 | 3/2,0,0,0 | 1688/A | 1953/ASR | 10/14/2021 |
| CONDO | 4315 W | 145Th ST #13 | $551,000 | $ 503 | 3/2,0,1,0 | 1096/ | 1994 | 10/14/2021 |
| SFR/D | 15203 | Florwood AVE | $700,000 | $ 671 | 3/1,0,1,0 | 1044/A | 1951/PUB | 10/15/2021 |
| SFR | 3613 W | 152Nd ST | $915,000 | $ 582 | 4/2,0,0,0 | 1572/ | 1977 | 10/18/2021 |
| SFR/D | 4202 | W 168th st ST | $725,000 | $ 512 | 3/2,0,0,0 | 1416/E | 1944/ASR | 10/18/2021 |
| SFR/D | 14922 | Kingsdale AVE | $636,500 | $ 787 | 2/1,0,0,0 | 809/A | 1947/PUB | 10/20/2021 |
| CONDO/A | 4633 | Marine AVE #128 | $410,000 | $ 426 | 2/2,0,0,0 | 963/A | 1973/ASR | 10/27/2021 |
| SFR/D | 4633 W | 152nd ST | $715,000 | $ 596 | 3/2,0,0,0 | 1200/A | 1962/PUB | 10/27/2021 |
| TWNHS/A | 4175 | Manhattan Beach BLVD | $480,000 | $ 343 | 2/2,0,0,0 | 1399/A | 1978/ASR | 10/28/2021 |
| SFR/D | 15422 | Gerkin AVE | $760,000 | $ 506 | 3/2,0,0,0 | 1502/A | 1952/ASR | 10/29/2021 |
| SFR/D | 4115 W | 160th ST | $720,000 | $ 667 | 3/2,0,0,0 | 1080/A | 1959/ASR | 10/29/2021 |
| DPLX/D | 4626 W | 167th ST | $920,000 | $ 513 | 5/3,0,0,0 | 1792/A | 1961/PUB | 11/3/2021 |
| TWNHS/A | 15111 | Freeman AVE #82 | $615,000 | $ 474 | 2/1,1,1,0 | 1298/A | 1985/ASR | 11/4/2021 |
| TWNHS/D | 4718 W | 167th ST | $805,000 | $ 479 | 3/3,0,0,0 | 1680/A | 2006/ASR | 11/4/2021 |
| CONDO/A | 14807 | Condon AVE #213 | $486,000 | $ 518 | 2/2,0,0,0 | 939/A | 1975/ASR | 11/5/2021 |
| SFR | 4117 W | 159Th ST | $880,000 | $ 460 | 4/3,0,0,0 | 1911/A | 1966/ASR | 11/9/2021 |
| SFR/D | 15016 | Mansel AVE | $884,700 | $ 394 | 3/2,0,1,0 | 2245/A | 1984/ASR | 11/12/2021 |
| CONDO | 4315 W | 145Th ST #4 | $560,000 | $ 420 | 3/3,0,0,0 | 1334/ | 1994 | 11/15/2021 |
| SFR/D | 15503 | Gerkin AVE | $890,000 | $ 613 | 3/1,0,1,0 | 1452/A | 1952/ASR | 11/16/2021 |
| SFR/D | 4700 | W 166th ST | $635,000 | $ 706 | 2/2,0,0,0 | 900/OTH | 1964/ASR | 11/16/2021 |
| CONDO | 4633 | Marine AVE #254 | $437,000 | $ 531 | 2/2,0,0,0 | 823/ | 1973 | 11/19/2021 |
| TWNHS/A | 4001 W | 165th St #D | $635,000 | $ 465 | 2/2,0,1,0 | 1365/A | 1994 | 11/22/2021 |
| SFR/D | 14727 | Avis AVE | $979,999 | $ 626 | 3/3,0,1,0 | 1565/O | 1955/ASR | 11/24/2021 |
| SFR/D | 14725 | Kingsdale AVE | $710,000 | $ 410 | 3/2,0,0,0 | 1731/A | 1978/ASR | 11/30/2021 |
| SFR/D | 15303 | Roselle AVE | $831,000 | $ 949 | 2/1,0,0,0 | 876/P | 1951/PUB | 12/3/2021 |
| SFR/D | 15318 | Cranbrook AVE | $801,000 | $ 613 | 3/2,0,0,0 | 1306/A | 1953/ASR | 12/10/2021 |
| DPLX/D | 4449 W | 163rd ST | $1,000,000 | $ 435 | 5/3,0,0,0 | 2299/P | 1952/PUB | 12/10/2021 |
| SFR/D | 4138 W | 162nd ST | $930,000 | $ 584 | 4/2,0,0,0 | 1593/A | 2019/ASR | 12/16/2021 |
| SFR/D | 4443 W | 149th ST | $615,000 | $ 729 | 2/1,0,0,0 | 844/A | 1953/ASR | 12/20/2021 |
| SFR/D | 4510 W | 147th ST | $570,000 | $ 824 | 2/1,0,0,0 | 692/A | 1924/ASR | 12/20/2021 |
| SFR/D | 16417 | Condon AVE | $640,000 | $ 762 | 2/1,0,0,0 | 840/A | 1956/ASR | 12/22/2021 |
| CONDO/A | 4633 | Marine AVE #219 | $375,000 | $ 591 | 1/1,0,0,0 | 634/A | 1973/ASR | 12/22/2021 |
| SFR | 4161 W | 162Nd ST | $562,500 | $ 1,023 | 1/1,0,0,0 | 550/ | 1948 | 12/27/2021 |
| SFR/D | 4758 W | 168th ST | $758,000 | $ 772 | 3/1,0,0,0 | 982/A | 1947/ASR | 12/28/2021 |
| CONDO/A | 4727 | 147 ST W #122 | $495,500 | $ 572 | 2/2,0,0,0 | 867/A | 1974/ASR | 12/30/2021 |
| CONDO/A | 4057 W | 147th ST #102 | $659,000 | $ 459 | 3/2,0,1,0 | 1435/A | 1995/ASR | 12/30/2021 |
| CONDO/A | 15111 | Freeman AVE #91 | $673,000 | $ 492 | 3/2,0,1,0 | 1369/A | 1985/ASR | 12/30/2021 |
| CONDO | 4746 W | 173rd ST #R | $602,500 | $ 588 | 2/1,0,1,0 | 1025/ | 1989 | 12/30/2021 |
From all of us a Lawndale Homes For Sale.com, Vista Sotheby’s International and Lawndale specialist Keith Kyle, we wanted to wish you and yours a very merry Christmas and happy holidays.

October was a big month for home sales in Lawndale CA with 18 on market homes, condos and townhomes closing. The average “list” price was $704,900 with the average “sold” price at $717,500 meaning that homes generally sold higher than the asking price. Average days on market was a slightly longer 45 days before going into escrow and the average price per foot was $557. See how this compares with other months on our Lawndale real estate statistics and trends page.
Search the current homes for sale in Lawndale CA
| Type | Address | Price | $ Per Foot | Bed/Bath | Sq Feet | Year | Sold Date | |
| SFR/D | 15203 | Florwood AVE | $700,000 | $670.50 | 3/1,0,1,0 | 1044/A | 1951/PUB | 10/15/2021 |
| SFR/D | 15422 | Gerkin AVE | $760,000 | $505.99 | 3/2,0,0,0 | 1502/A | 1952/ASR | 10/29/2021 |
| SFR/D | 3728 W | 156th ST | $763,000 | $597.96 | 3/2,0,0,0 | 1276/A | 1952/ASR | 10/8/2021 |
| SFR/D | 15213 | Cranbrook AVE | $820,000 | $485.78 | 3/2,0,0,0 | 1688/A | 1953/ASR | 10/14/2021 |
| SFR | 3613 W | 152Nd ST | $915,000 | $582.06 | 4/2,0,0,0 | 1572/ | 1977 | 10/18/2021 |
| CONDO/A | 4633 | Marine AVE #128 | $410,000 | $425.75 | 2/2,0,0,0 | 963/A | 1973/ASR | 10/27/2021 |
| CONDO/A | 4633 | Marine AVE #214 | $460,000 | $481.68 | 2/2,0,0,0 | 955/A | 1973/ASR | 10/8/2021 |
| TWNHS/A | 4175 | Manhattan Beach BLVD | $480,000 | $343.10 | 2/2,0,0,0 | 1399/A | 1978/ASR | 10/28/2021 |
| CONDO/A | 4727 W | 147th ST #219 | $505,000 | $442.59 | 3/2,0,0,0 | 1141/A | 1974/ASR | 10/5/2021 |
| CONDO | 4315 W | 145Th ST #13 | $551,000 | $502.74 | 3/2,0,1,0 | 1096/ | 1994 | 10/14/2021 |
| SFR/D | 14922 | Kingsdale AVE | $636,500 | $786.77 | 2/1,0,0,0 | 809/A | 1947/PUB | 10/20/2021 |
| SFR/D | 4633 W | 152nd ST | $715,000 | $595.83 | 3/2,0,0,0 | 1200/A | 1962/PUB | 10/27/2021 |
| SFR/D | 4611 W | 149th ST | $870,000 | $492.08 | 3/2,0,0,0 | 1768/A | 1968/ASR | 10/13/2021 |
| SFR/D | 4549 W | 160th ST | $630,000 | $870.17 | 2/1,0,0,0 | 724/A | 1947/ASR | 10/12/2021 |
| SFR/D | 4115 W | 160th ST | $720,000 | $666.67 | 3/2,0,0,0 | 1080/A | 1959/ASR | 10/29/2021 |
| TWNHS/D | 4169 W | 166th ST | $940,000 | $362.37 | 4/4,0,0,0 | 2594/A | 2007/ASR | 10/5/2021 |
| SFR/D | 4202 | W 168th st ST | $725,000 | $512.01 | 3/2,0,0,0 | 1416/E | 1944/ASR | 10/18/2021 |
| SFR/D | 15303 | Kornblum AVE | $778,000 | $702.17 | 3/1,0,0,0 | 1108/A | 1951/ASR | 10/6/2021 |