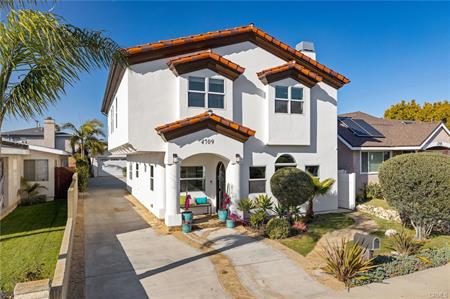
Take a look at all of the homes that sold in Lawndale during 2021. It was a great year with 157 on market (MLS) home sales. The average asking price was $678,000 with the average sold price at $696,000 for the year. Homes averaged only 24 days on the market before going into escrow.
View the current homes for sale in Lawndale
2021 Home Sales and Home Prices in Lawndale CA
| Type |
|
Address |
Price |
$ Per Foot |
Bed/Bath |
Sq Feet |
Year |
Sold Date |
| SFR/D |
14916 |
Firmona AVE |
$750,000 |
$ 403 |
3/2,0,0,1 |
1862/A |
1984/ASR |
1/5/2021 |
| CONDO/A |
4727 W |
147th ST #239 |
$390,000 |
$ 415 |
2/1,0,1,0 |
939/A |
1974/ASR |
1/12/2021 |
| SFR |
4173 W |
161St ST |
$614,250 |
$ 351 |
3/3,0,0,0 |
1750/ |
1991 |
1/12/2021 |
| SFR/D |
15633 |
Larch AVE |
$749,900 |
$ 506 |
4/2,0,0,0 |
1483/A |
1950/ASR |
1/14/2021 |
| SFR/D |
4040 W |
160th ST |
$592,000 |
$ 553 |
3/2,0,0,0 |
1071/A |
1916/ASR |
1/14/2021 |
| TWNHS/A |
14927 |
Condon AVE #1 |
$610,000 |
$ 398 |
3/2,0,1,0 |
1531/A |
1985/PUB |
1/15/2021 |
| SFR/D |
15411 |
Larch AVE |
$575,000 |
$ 821 |
2/1,0,0,0 |
700/A |
1950/ASR |
1/20/2021 |
| SFR/D |
14611 |
Firmona AVE |
$580,000 |
$ 701 |
2/1,0,0,0 |
827/A |
1951/ASR |
1/22/2021 |
| SFR/D |
4124 W |
159th ST |
$799,000 |
$ 349 |
6/1,2,0,0 |
2287/A |
1956/ASR |
1/22/2021 |
| SFR |
14316 |
Kingsdale AVE |
$405,000 |
$ 592 |
2/1,0,0,0 |
684/ |
1948 |
1/26/2021 |
| SFR/D |
15308 |
Prairie AVE |
$742,000 |
$ 482 |
3/2,0,0,0 |
1539/A |
1952/ASR |
1/29/2021 |
| TWNHS/A |
14807 |
Condon AVE #106 |
$500,000 |
$ 377 |
3/2,0,1,0 |
1326/A |
1975/ASR |
1/29/2021 |
| SFR/D |
14508 |
KINGSDALE AVE |
$645,000 |
$ 794 |
2/1,0,0,0 |
812/O |
1950/SLR |
1/29/2021 |
| SFR/D |
15437 |
Grevillea AVE |
$590,000 |
$ 613 |
3/1,0,0,0 |
962/A |
1948/ASR |
2/2/2021 |
| SFR/D |
4738 W |
153rd PL |
$600,000 |
$ 606 |
3/1,0,0,0 |
990/A |
1950/ASR |
2/9/2021 |
| TWNHS/D |
4626 W |
163rd ST |
$812,000 |
$ 470 |
3/2,2,0,0 |
1728/B |
2020/BLD |
2/9/2021 |
| TWNHS/D |
4628 W |
163rd ST |
$812,000 |
$ 470 |
3/2,2,0,0 |
1728/B |
2020/BLD |
2/10/2021 |
| TWNHS/A |
4176 W |
147th ST #401 |
$537,500 |
$ 406 |
2/2,0,1,0 |
1324/A |
1989/ASR |
2/17/2021 |
| TWNHS/A |
4003 W |
165th ST #G |
$590,000 |
$ 445 |
2/3,0,0,0 |
1327/A |
1994/PUB |
2/17/2021 |
| SFR/D |
15429 |
Larch AVE #E |
$630,000 |
$ 307 |
4/3,0,0,0 |
2052/A |
1979/ASR |
2/23/2021 |
| SFR/D |
15027 |
Kingsdale AVE |
$599,000 |
$ 638 |
3/1,0,0,0 |
939/A |
1951/ASR |
2/25/2021 |
| TWNHS/A |
4746 W |
173rd ST #H |
$552,000 |
$ 539 |
2/1,0,1,0 |
1025/A |
1990/PUB |
2/26/2021 |
| SFR/D |
15322 |
Kornblum AVE |
$720,000 |
$ 690 |
2/1,1,0,0 |
1044/A |
1951/ASR |
3/4/2021 |
| TWNHS/A |
15111 |
Freeman AVE #9 |
$600,000 |
$ 462 |
2/1,1,1,0 |
1298/A |
1985/ASR |
3/5/2021 |
| SFR/D |
4621 W |
167th ST |
$660,000 |
$ 757 |
2/2,0,0,0 |
872/E |
1930/ASR |
3/5/2021 |
| SFR/D |
4705 W |
169th ST |
$690,000 |
$ 658 |
3/2,0,0,0 |
1048/A |
1957/ASR |
3/5/2021 |
| SFR/D |
15403 |
Roselle AVE |
$785,000 |
$ 604 |
3/2,0,0,0 |
1300/A |
1952/ASR |
3/6/2021 |
| CONDO/D |
15209 |
Larch AVE |
$680,000 |
$ 320 |
3/2,0,1,0 |
2127/A |
2004/ASR |
3/9/2021 |
| SFR/D |
4641 W |
161st ST |
$850,000 |
$ 679 |
3/2,0,0,0 |
1252/A |
1956/ASR |
3/10/2021 |
| SFR/D |
15707 |
Sayler AVE |
$800,000 |
$ 583 |
3/1,1,0,0 |
1372/A |
1955/ASR |
3/12/2021 |
| SFR/D |
4604 W |
148th ST |
$600,500 |
$ 423 |
3/1,0,1,0 |
1419/A |
1961/ASR |
3/16/2021 |
| TWNHS/D |
15429 |
Larch AVE #F |
$697,500 |
$ 340 |
4/2,0,1,0 |
2052/A |
1979/ASR |
3/16/2021 |
| SFR/D |
15519 |
Roselle AVE |
$780,100 |
$ 762 |
3/1,0,0,0 |
1024/A |
1952/ASR |
3/22/2021 |
| TWNHS/A |
4702 W |
159th ST #C |
$706,000 |
$ 421 |
3/3,0,0,0 |
1675/A |
1993/ASR |
3/22/2021 |
| SFR/D |
4431 W |
162nd ST |
$795,000 |
$ 465 |
3/1,1,0,0 |
1711/A |
1972/ASR |
3/22/2021 |
| SFR/D |
15232 |
Fonthill AVE |
$865,000 |
$ 520 |
3/2,0,0,0 |
1664/A |
1951/ASR |
3/25/2021 |
| TWNHS/A |
4169 |
Manhattan Beach BLVD |
$508,000 |
$ 363 |
2/2,0,0,0 |
1399/A |
1978/ASR |
3/26/2021 |
| CONDO/A |
14807 |
Condon AVE #221 |
$416,000 |
$ 406 |
2/1,1,0,0 |
1024/A |
1975/ASR |
3/31/2021 |
| SFR/D |
14804 |
Kingsdale AVE |
$635,000 |
$ 526 |
2/1,0,0,0 |
1207/A |
1948/ASR |
4/2/2021 |
| SFR/D |
3852 W |
157th ST |
$858,500 |
$ 372 |
3/1,2,0,0 |
2306/A |
1952/ASR |
4/5/2021 |
| SFR/D |
4231 W |
164th ST |
$785,000 |
$ 650 |
3/2,0,0,0 |
1207/A |
1946/SLR |
4/5/2021 |
| SFR/D |
15406 |
Roselle AVE |
$690,000 |
$ 673 |
3/1,0,0,0 |
1026/A |
1952/ASR |
4/6/2021 |
| SFR/D |
4544 W |
156th ST |
$844,000 |
$ 525 |
4/2,0,1,0 |
1608/A |
1956/ASR |
4/8/2021 |
| SFR/D |
15413 |
Roselle AVE |
$750,000 |
$ 732 |
3/1,0,0,0 |
1024/A |
1952/ASR |
4/9/2021 |
| CONDO/A |
4727 W |
147Th ST #119 |
$460,000 |
$ 403 |
3/2,0,0,0 |
1141/A |
1974/ASR |
4/9/2021 |
| SFR/D |
4709 W |
171st ST |
$1,450,000 |
$ 442 |
5/3,0,0,0 |
3284/A |
2007/ASR |
4/15/2021 |
| SFR/D |
15202 |
Fonthill AVE |
$810,000 |
$ 526 |
3/2,0,0,0 |
1539/A |
1951/ASR |
4/20/2021 |
| SFR/D |
4137 W |
159th ST |
$640,000 |
$ 500 |
3/1,1,0,0 |
1280/A |
1954/ASR |
4/20/2021 |
| SFR/D |
15626 |
Larch AVE |
$670,000 |
$ 495 |
3/3,0,0,0 |
1353/A |
2003/ASR |
4/21/2021 |
| CONDO/A |
14807 |
Condon AVE #118 |
$479,000 |
$ 510 |
2/2,0,0,0 |
939/A |
1975/ASR |
4/28/2021 |
| SFR/D |
15323 |
Yukon Ave. |
$870,000 |
$ 553 |
4/2,0,0,0 |
1572/A |
1977/ASR |
4/29/2021 |
| SFR |
15133 |
Florwood AVE |
$780,000 |
$ 704 |
3/1,0,0,0 |
1108/ |
1951 |
4/30/2021 |
| TWNHS/A |
15111 |
Freeman AVE #24 |
$610,000 |
$ 451 |
3/2,0,1,0 |
1352/A |
1985/ASR |
4/30/2021 |
| SFR/D |
4035 W |
159th ST |
$740,100 |
$ 544 |
3/0,2,0,0 |
1361/A |
1940/ASR |
5/3/2021 |
| SFR/D |
14929 |
Grevillea AVE |
$800,000 |
$ 379 |
3/2,0,1,0 |
2110/A |
1989/ASR |
5/4/2021 |
| SFR/D |
15307 |
Condon AVE |
$625,000 |
$ 926 |
2/1,0,0,0 |
675/A |
1951/ASR |
5/14/2021 |
| SFR/D |
4339 W |
163rd ST |
$605,000 |
$ 362 |
2/2,0,0,0 |
1669/A |
1948/ASR |
5/19/2021 |
| CONDO/A |
4057 W |
147 ST #106 |
$620,000 |
$ 368 |
3/2,0,0,1 |
1685/P |
1995/PUB |
5/26/2021 |
| TWNHS/A |
4721 W |
170th ST |
$810,000 |
$ 415 |
4/3,0,0,0 |
1952/A |
2004/PUB |
5/30/2021 |
| SFR/D |
4604 W |
162nd ST |
$745,000 |
$ 675 |
2/1,1,0,0 |
1104/A |
1924/ASR |
6/7/2021 |
| SFR/D |
14424 |
Firmona AVE |
$610,000 |
$ 472 |
3/2,0,0,0 |
1292/A |
1961/PUB |
6/11/2021 |
| CONDO/A |
14807 |
Condon AVE #212 |
$459,000 |
$ 489 |
2/2,0,0,0 |
939/A |
1975/ASR |
6/15/2021 |
| SFR/D |
15011 |
Kingsdale AVE |
$840,000 |
$ 386 |
3/2,0,1,0 |
2177/A |
1990/ASR |
6/15/2021 |
| SFR/D |
4134 W |
165th ST |
$825,000 |
$ 413 |
3/2,0,0,0 |
2000/A |
1969/ASR |
6/15/2021 |
| SFR/D |
15503 |
Roselle AVE |
$755,000 |
$ 710 |
3/1,0,0,0 |
1063/A |
1952/ASR |
6/17/2021 |
| CONDO/A |
4633 |
Marine AVE #245 |
$425,000 |
$ 441 |
2/2,0,0,0 |
963/A |
1973/ASR |
6/17/2021 |
| CONDO/A |
14807 |
Condon AVE #221 |
$523,000 |
$ 511 |
2/2,0,0,0 |
1024/A |
1975/ASR |
6/17/2021 |
| TWNHS/D |
4501 W |
171st ST |
$940,000 |
$ 356 |
4/1,1,1,0 |
2638/A |
2007/PUB |
6/18/2021 |
| CONDO/A |
4633 |
Marine AVE #261 |
$340,000 |
$ 643 |
1/1,0,0,0 |
529/A |
1973/PUB |
6/18/2021 |
| TWNHS/D |
4551 W |
171st ST |
$875,000 |
$ 400 |
3/2,0,1,0 |
2188/A |
1989/ASR |
6/22/2021 |
| SFR/D |
15132 |
Doty AVE |
$795,500 |
$ 798 |
3/1,0,0,0 |
997/A |
1951/ASR |
6/25/2021 |
| SFR/D |
14800 |
Burin AVE |
$719,000 |
$ 378 |
4/3,0,0,0 |
1904/A |
1966/ASR |
6/25/2021 |
| SFR/D |
4564 W |
156th ST |
$735,000 |
$ 420 |
4/2,0,1,0 |
1751/A |
2006/ASR |
6/25/2021 |
| SFR/D |
4323 W |
171st ST |
$695,000 |
$ 693 |
3/1,0,0,0 |
1003/A |
1944/ASR |
7/6/2021 |
| SFR/D |
14418 |
Kingsdale AVE |
$615,000 |
$ 568 |
3/2,0,0,0 |
1083/A |
1962/ASR |
7/8/2021 |
| SFR/D |
15211 |
Polly AVE |
$921,415 |
$ 527 |
4/3,0,0,0 |
1747/A |
1977/ASR |
7/12/2021 |
| CONDO/A |
15111 |
Freeman AVE #92 |
$660,000 |
$ 482 |
3/2,0,1,0 |
1369/A |
1985/ASR |
7/13/2021 |
| SFR/A |
4625 W |
145th ST |
$855,000 |
$ 530 |
4/3,0,0,0 |
1614/A |
1951/ASR |
7/13/2021 |
| CONDO/A |
4315 W |
145th ST #5 |
$532,000 |
$ 399 |
3/3,0,0,0 |
1333/A |
1994/ASR |
7/15/2021 |
| SFR/D |
15414 |
Condon AVE |
$650,000 |
$ 892 |
2/1,0,0,0 |
729/A |
1951/ASR |
7/19/2021 |
| SFR/D |
4625 W |
162nd ST |
$688,000 |
$ 673 |
3/1,0,0,0 |
1023/A |
1956/PUB |
7/19/2021 |
| SFR/D |
4143 W |
159th ST |
$772,000 |
$ 634 |
3/1,1,0,0 |
1218/A |
1949/PUB |
7/20/2021 |
| SFR/D |
4735 W |
172nd ST |
$880,000 |
$ 925 |
3/1,0,0,0 |
951/A |
1953/ASR |
7/20/2021 |
| SFR/D |
4327 W |
163rd ST |
$615,000 |
$ 792 |
2/1,0,0,0 |
777/A |
1947/APP |
7/23/2021 |
| SFR |
4743 W |
164Th ST |
$930,000 |
$ 517 |
4/3,0,0,0 |
1800/OTH |
1952/ASR |
7/23/2021 |
| CONDO/A |
4727 W |
147th ST #231 |
$435,000 |
$ 502 |
2/2,0,0,0 |
867/A |
1974/ASR |
7/26/2021 |
| SFR/D |
14507 |
Larch AVE |
$560,000 |
$ 459 |
3/1,0,1,0 |
1220/A |
1965/ASR |
7/27/2021 |
| SFR/D |
15004 |
Mansel AVE |
$675,000 |
$ 314 |
3/2,0,0,1 |
2147/A |
1980/ASR |
7/27/2021 |
| SFR/D |
15413 |
Doty AVE |
$770,000 |
$ 724 |
3/1,0,0,0 |
1063/A |
1952/ASR |
7/28/2021 |
| SFR/D |
15403 |
Florwood AVE |
$735,000 |
$ 713 |
3/1,0,0,0 |
1031/A |
1952/ASR |
7/30/2021 |
| TWNHS/A |
4157 W |
166th ST |
$789,000 |
$ 372 |
3/2,0,1,0 |
2119/A |
2003/ASR |
7/30/2021 |
| SFR/D |
15316 |
Kornblum AVE |
$720,000 |
$ 651 |
3/1,0,0,0 |
1106/A |
1951/ASR |
8/3/2021 |
| SFR/D |
15232 |
Cordary AVE |
$877,000 |
$ 578 |
3/2,0,0,0 |
1518/A |
1951/ASR |
8/3/2021 |
| CONDO |
14807 |
Condon AVE #211 |
$510,000 |
$ 543 |
2/2,0,0,0 |
939/ |
1975 |
8/4/2021 |
| SFR/D |
4561 W |
162nd ST |
$770,000 |
$ 605 |
4/2,0,0,0 |
1272/A |
1954/ASR |
8/5/2021 |
| DPLX/D |
4307 W |
160th ST |
$730,000 |
$ 424 |
5/2,0,0,0 |
1722/SEE |
1961/SEE |
8/16/2021 |
| SFR/D |
15008 |
Mansel AVE |
$835,000 |
$ 440 |
3/2,0,1,0 |
1897/A |
1984/ASR |
8/18/2021 |
| SFR/D |
15603 |
Florwood AVE |
$965,000 |
$ 758 |
3/2,0,0,0 |
1273/A |
1952/PUB |
8/20/2021 |
| SFR/D |
4722 W |
166th ST |
$950,000 |
$ 810 |
3/2,0,0,0 |
1173/O |
1942/PUB |
8/25/2021 |
| SFR/D |
15522 |
Cordary AVE |
$890,000 |
$ 736 |
3/2,0,0,0 |
1210/T |
1952/ASR |
8/26/2021 |
| CONDO |
4727 W |
147Th ST #122 |
$390,000 |
$ 450 |
2/2,0,0,0 |
867/ |
1974 |
8/27/2021 |
| SFR/D |
15206 |
Cordary AVE |
$820,000 |
$ 590 |
4/2,0,0,0 |
1390/A |
1951/ASR |
8/31/2021 |
| SFR/D |
15329 |
Doty AVE |
$812,500 |
$ 778 |
3/1,0,0,0 |
1044/A |
1951/ASR |
9/14/2021 |
| SFR/D |
15226 |
Prairie AVE |
$795,107 |
$ 733 |
3/1,0,0,0 |
1085/A |
1952/ASR |
9/17/2021 |
| CONDO/A |
14528 |
Avis AVE #6 |
$450,000 |
$ 456 |
2/2,0,0,0 |
987/A |
1989/ASR |
9/20/2021 |
| TWNHS/A |
15111 |
Freeman AVE #90 |
$658,000 |
$ 489 |
3/3,0,0,0 |
1345/A |
1985/ASR |
9/20/2021 |
| SFR/D |
15220 |
Prairie AVE |
$795,500 |
$ 739 |
3/1,0,0,0 |
1077/A |
1952/ASR |
9/23/2021 |
| DPLX/A |
15015 |
Osage AVE |
$710,000 |
$ 228 |
6/4,0,0,0 |
3120/A |
1983/ASR |
9/24/2021 |
| CONDO/A |
4727 W |
147th ST #137 |
$395,000 |
$ 426 |
2/2,0,0,0 |
928/A |
1974/ASR |
9/27/2021 |
| SFR/D |
15224 |
Condon AVE |
$625,000 |
$ 716 |
2/1,0,0,0 |
873/A |
1952/ASR |
9/28/2021 |
| SFR/D |
15503 |
Cordary AVE |
$775,000 |
$ 438 |
3/1,2,0,0 |
1771/S |
1952/ASR |
9/30/2021 |
| CONDO/A |
4727 W |
147th ST #219 |
$505,000 |
$ 443 |
3/2,0,0,0 |
1141/A |
1974/ASR |
10/5/2021 |
| TWNHS/D |
4169 W |
166th ST |
$940,000 |
$ 362 |
4/4,0,0,0 |
2594/A |
2007/ASR |
10/5/2021 |
| SFR/D |
15303 |
Kornblum AVE |
$778,000 |
$ 702 |
3/1,0,0,0 |
1108/A |
1951/ASR |
10/6/2021 |
| SFR/D |
3728 W |
156th ST |
$763,000 |
$ 598 |
3/2,0,0,0 |
1276/A |
1952/ASR |
10/8/2021 |
| CONDO/A |
4633 |
Marine AVE #214 |
$460,000 |
$ 482 |
2/2,0,0,0 |
955/A |
1973/ASR |
10/8/2021 |
| SFR/D |
4549 W |
160th ST |
$630,000 |
$ 870 |
2/1,0,0,0 |
724/A |
1947/ASR |
10/12/2021 |
| SFR/D |
4611 W |
149th ST |
$870,000 |
$ 492 |
3/2,0,0,0 |
1768/A |
1968/ASR |
10/13/2021 |
| SFR/D |
15213 |
Cranbrook AVE |
$820,000 |
$ 486 |
3/2,0,0,0 |
1688/A |
1953/ASR |
10/14/2021 |
| CONDO |
4315 W |
145Th ST #13 |
$551,000 |
$ 503 |
3/2,0,1,0 |
1096/ |
1994 |
10/14/2021 |
| SFR/D |
15203 |
Florwood AVE |
$700,000 |
$ 671 |
3/1,0,1,0 |
1044/A |
1951/PUB |
10/15/2021 |
| SFR |
3613 W |
152Nd ST |
$915,000 |
$ 582 |
4/2,0,0,0 |
1572/ |
1977 |
10/18/2021 |
| SFR/D |
4202 |
W 168th st ST |
$725,000 |
$ 512 |
3/2,0,0,0 |
1416/E |
1944/ASR |
10/18/2021 |
| SFR/D |
14922 |
Kingsdale AVE |
$636,500 |
$ 787 |
2/1,0,0,0 |
809/A |
1947/PUB |
10/20/2021 |
| CONDO/A |
4633 |
Marine AVE #128 |
$410,000 |
$ 426 |
2/2,0,0,0 |
963/A |
1973/ASR |
10/27/2021 |
| SFR/D |
4633 W |
152nd ST |
$715,000 |
$ 596 |
3/2,0,0,0 |
1200/A |
1962/PUB |
10/27/2021 |
| TWNHS/A |
4175 |
Manhattan Beach BLVD |
$480,000 |
$ 343 |
2/2,0,0,0 |
1399/A |
1978/ASR |
10/28/2021 |
| SFR/D |
15422 |
Gerkin AVE |
$760,000 |
$ 506 |
3/2,0,0,0 |
1502/A |
1952/ASR |
10/29/2021 |
| SFR/D |
4115 W |
160th ST |
$720,000 |
$ 667 |
3/2,0,0,0 |
1080/A |
1959/ASR |
10/29/2021 |
| DPLX/D |
4626 W |
167th ST |
$920,000 |
$ 513 |
5/3,0,0,0 |
1792/A |
1961/PUB |
11/3/2021 |
| TWNHS/A |
15111 |
Freeman AVE #82 |
$615,000 |
$ 474 |
2/1,1,1,0 |
1298/A |
1985/ASR |
11/4/2021 |
| TWNHS/D |
4718 W |
167th ST |
$805,000 |
$ 479 |
3/3,0,0,0 |
1680/A |
2006/ASR |
11/4/2021 |
| CONDO/A |
14807 |
Condon AVE #213 |
$486,000 |
$ 518 |
2/2,0,0,0 |
939/A |
1975/ASR |
11/5/2021 |
| SFR |
4117 W |
159Th ST |
$880,000 |
$ 460 |
4/3,0,0,0 |
1911/A |
1966/ASR |
11/9/2021 |
| SFR/D |
15016 |
Mansel AVE |
$884,700 |
$ 394 |
3/2,0,1,0 |
2245/A |
1984/ASR |
11/12/2021 |
| CONDO |
4315 W |
145Th ST #4 |
$560,000 |
$ 420 |
3/3,0,0,0 |
1334/ |
1994 |
11/15/2021 |
| SFR/D |
15503 |
Gerkin AVE |
$890,000 |
$ 613 |
3/1,0,1,0 |
1452/A |
1952/ASR |
11/16/2021 |
| SFR/D |
4700 |
W 166th ST |
$635,000 |
$ 706 |
2/2,0,0,0 |
900/OTH |
1964/ASR |
11/16/2021 |
| CONDO |
4633 |
Marine AVE #254 |
$437,000 |
$ 531 |
2/2,0,0,0 |
823/ |
1973 |
11/19/2021 |
| TWNHS/A |
4001 W |
165th St #D |
$635,000 |
$ 465 |
2/2,0,1,0 |
1365/A |
1994 |
11/22/2021 |
| SFR/D |
14727 |
Avis AVE |
$979,999 |
$ 626 |
3/3,0,1,0 |
1565/O |
1955/ASR |
11/24/2021 |
| SFR/D |
14725 |
Kingsdale AVE |
$710,000 |
$ 410 |
3/2,0,0,0 |
1731/A |
1978/ASR |
11/30/2021 |
| SFR/D |
15303 |
Roselle AVE |
$831,000 |
$ 949 |
2/1,0,0,0 |
876/P |
1951/PUB |
12/3/2021 |
| SFR/D |
15318 |
Cranbrook AVE |
$801,000 |
$ 613 |
3/2,0,0,0 |
1306/A |
1953/ASR |
12/10/2021 |
| DPLX/D |
4449 W |
163rd ST |
$1,000,000 |
$ 435 |
5/3,0,0,0 |
2299/P |
1952/PUB |
12/10/2021 |
| SFR/D |
4138 W |
162nd ST |
$930,000 |
$ 584 |
4/2,0,0,0 |
1593/A |
2019/ASR |
12/16/2021 |
| SFR/D |
4443 W |
149th ST |
$615,000 |
$ 729 |
2/1,0,0,0 |
844/A |
1953/ASR |
12/20/2021 |
| SFR/D |
4510 W |
147th ST |
$570,000 |
$ 824 |
2/1,0,0,0 |
692/A |
1924/ASR |
12/20/2021 |
| SFR/D |
16417 |
Condon AVE |
$640,000 |
$ 762 |
2/1,0,0,0 |
840/A |
1956/ASR |
12/22/2021 |
| CONDO/A |
4633 |
Marine AVE #219 |
$375,000 |
$ 591 |
1/1,0,0,0 |
634/A |
1973/ASR |
12/22/2021 |
| SFR |
4161 W |
162Nd ST |
$562,500 |
$ 1,023 |
1/1,0,0,0 |
550/ |
1948 |
12/27/2021 |
| SFR/D |
4758 W |
168th ST |
$758,000 |
$ 772 |
3/1,0,0,0 |
982/A |
1947/ASR |
12/28/2021 |
| CONDO/A |
4727 |
147 ST W #122 |
$495,500 |
$ 572 |
2/2,0,0,0 |
867/A |
1974/ASR |
12/30/2021 |
| CONDO/A |
4057 W |
147th ST #102 |
$659,000 |
$ 459 |
3/2,0,1,0 |
1435/A |
1995/ASR |
12/30/2021 |
| CONDO/A |
15111 |
Freeman AVE #91 |
$673,000 |
$ 492 |
3/2,0,1,0 |
1369/A |
1985/ASR |
12/30/2021 |
| CONDO |
4746 W |
173rd ST #R |
$602,500 |
$ 588 |
2/1,0,1,0 |
1025/ |
1989 |
12/30/2021 |
Keith Kyle with Vista Sotheby’s International Realty is a top producing realtor and a Lawndale and El Camino Village real estate specialist.